mView.py User Guide
The mViewer Python distribution includes a small driver script to make it convenient to quickly display data files interactively. This is only meant for simple use but actually covers a fair amount of ground. It can also serve as a starting point for developing specialized custom interfaces using mViewer (and Montage in general).
To just start the display of a single image, run
mView.py data.fits
or for full color:
mView.py blue.fits green.fits red.fits
For more complicated displays, it is better to use named parameters:
   mView.py --color   blue.fits green.fits red.fits  \
            --grid    Equatorial J2000               \
            --catalog fp_2mass.tbl                   \
            --images  irsmap.tbl
The "color" parameter can be replaced with "gray" with a single file name. The three overlay parameters can be repeated. There is also the standard "--help" directive and a "--server" mode flag (for remote display; described elsewhere).
This is enough to get all the data up on the screen, though the user is left with the task of changing things like color, symbol scaling, image stretches and grayscale color table manually.
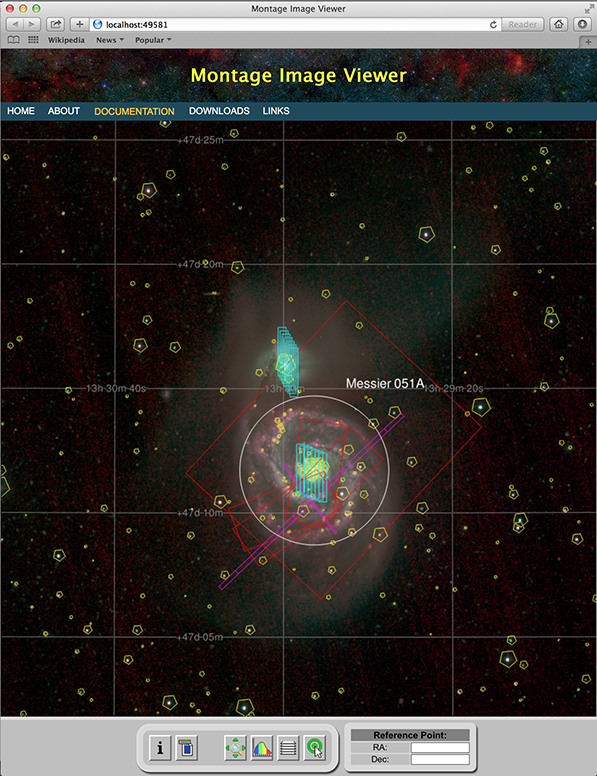
For a more detailed specification, mView.py uses a JSON file:
mView.py --json display.json
The JSON is illustrated below.
NOTES
The image section contains information on the FITS files to display, with stretching parameters and, in the case of grayscale, the color lookup table.
The overlays section describes the layers that will be drawn on top of the image. There can be any number of these and each type has its own parameters.
This catalog overlay includes all the possible specifications. Many of these can be omitted. For instance, if there are no symbol scaling parameters, you will get a default, fixed-sized circle.
Image metadata tables contain the four corners of the image on the sky or enough WCS information to compute the image outline.
Coordinate grids can be in equatorial or ecliptic coordinates (optionally with equinox), galactic or supergalactic.
The marker and label options are meant to be used for a few simple annotations. For large numbers, the underlying plotter is capable of supporting table input and a parameters for label (and symbol shape/size) columns can be added to 'catalog' directive above.
At the moment, we only support a single font file, this can be swapped out for any other and, if in need, we can generalize this.
display.json
{
   "image" :
   {
      "type" : "color",

      "blue":
      {
         "file" : "fits/SDSS_g_small.fits",
         "min"  : "-0.4s",
         "max"  : "max",
         "mode" : "gaussian-log"
      },

      "green":
      {
         "file" : "fits/SDSS_r_small.fits",
         "min"  : "-0.4s",
         "max"  : "max",
         "mode" : "gaussian-log"
      },

      "red":
      {
         "file" : "fits/SDSS_u_small.fits",
         "min"  : "-0.4s",
         "max"  : "max",
         "mode" : "gaussian-log"
      }
   },


   "overlays":
   [
      {

         "type"            : "catalog",
         "file"            : "tbl/fp_2mass.tbl",
         "coord_sys"       : "Equatorial J2000",
         "column"          : "j_m",
         "ref_value"       : 16.0,
         "data_type"       : "mag",
         "symbol_size"     : 1.0,
         "symbol_type"     : "polygon",
         "symbol_sides"    : 5,
         "symbol_rotation" : 30,
         "color"           : "ffff00"
      },

      {

         "type"  : "imginfo",
         "file"  : "tbl/irspeakup.tbl",
         "color" : "red"
      },

      {
         "type"  : "imginfo",
         "file"  : "tbl/irsstare.tbl",
         "color" : "magenta"
      },

      {
         "type"  : "imginfo",
         "file"  : "tbl/mipssed.tbl",
         "color" : "cyan"
      },

      {
         "type"  : "grid",
         "csys"  : "Equatorial J2000",
         "color" : "lightgray"
      },

      {
         "type"        : "marker",
         "lon"         :  202.46963,
         "lat"         :  47.19517,
         "symbol_size" :  50.0,
         "symbol_type" : "circle",
         "color"       : "white"
      },

      {
         "type" : "label",
         "lon"  :  202.41667,
         "lat"  :  47.25333,
         "text" : "Messier 051A"
      }
   ]
}