A Good Development LLC
mViewer Controls
Except for a few simple drawn graphics like a zoom box the GUI has no part in constructing the display; that is done in the C code which generates a PNG that the browser then downloads and displays. The mViewer C code needs to be handed a complete specification for a display image in the form of a JSON structure passed to Python from the GUI.
In general, the GUI controls that I have built are just tweaking the JSON inherited from the previous image generation, but this could easily be extented to support any kind of manipulation. The toolkit maintains no other knowledge of the display attributes beyond what is in this JSON, so a complete restructuring (new images, different overlays, different zooming) would be no trouble.
The controls described here are just an initial set aimed at adjusting the display of the current image and can easily be augmented or replaced for an extended or alternate use case.
- Color Manipulation
- Overlay Control
- Zooming and Panning
- Image Region Statistics
- FITS File Header
- Display Image Info
These controls are activated by buttons in the bar at the bottom of the page. Each control pops up in a floating window that can be closed without voiding changes.
Color Manipulation
The Montage module mViewer is a C program which renders astronomical FITS-format images in PNG or JPEG formats. Originally designed for use in scripts or processing pipelines, mViewer supports a number of options.
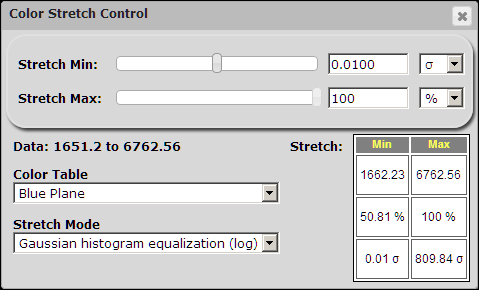
This control covers both the transformation from image data value to color table lookup and, in the case of grayscale images, the transformation to color value. In the case of three-color images, the transformed data value is directly used a the brightness in each of the three color planes (red, green and blue).
There are various transform functions that can be use for the first step, chosen by means of the, "Stretch Mode," pulldown. These include a basic linear transform, logarithmic (since astronomical images have a wide dynamic range), and log-log (since the aformentioned dynamic range can be very large indeed).
Even log-log is frequently not nuanced enough to deal with the extremes of brightness distribution. An astronomical image histogram usually has a big gaussian-like bulge near the mean value but this is frequently all background noise and all the interesting features are in the (very) long positive tail of the distribution. Consequently, normal histogram equalization works poorly, accentuating the low-level noise and saturating all of the interesting structure.
The mViewer C module therefore has a couple of custom transform functions. These are based on the histogram but throw in a gaussian error function transform (so as not to focus too much on the "noise" bulge) and, optionally, a log transform on top of that which deals with the extremely bright pixels at the top end of the distribution.
The default transform is this, "Gaussian histogram equalization (log)," function, which usually does a very good job of generating an informative first look at any image. Often the only tweaks needed are to the stretch minimum, depending on whether the background in the field is mostly noise (stretch minimum of +1 sigma works well for this) or mostly structure (stretch minimum of -2 sigma). By choosing to set the min/max values as "sigma", we are basing it on the histogram distribution width rather than data values (which vary from image to image) or percentiles (which do not take into account the distribution sharpness. However, there are some images where the other units work better.
The stretch in all three systems are output to help in making decisions and understanding the data.
For a single image, there are several, "color tables," that can be chosen. The most commonly used are a simple grayscale (a ramp from black to white), reverse grayscale (since subtle structure is often more apparent in a negative), and "spectral" which runs from black to blue then through the spectrum to red then to white.
Overlay Control

mViewer supports five kinds of overlays: Coordinate grids; source tables (astronomical catalogs); image metadata tables (outlines); single makers; and labels. There can be any number of each of these and they can be drawn in any order.
This control lets the user control the details of each overlay. All support color selection but the details are otherwise type-dependent. For instance, the only other parameter associated with a coordinate grid is the choice of coordinate system. Labels have location and label text.
For image outlines and source tables, the input data takes the form of an IPAC ASCII table file. The former has to have columns "ra1", "dec1" through "ra4", "dec4" (decimal degrees). The latter has "ra" and "dec" and optionally a column we want to use to scale the symbols. The scaling parameters are otherwise on the form.
The form consists of a table with one row per overlay. Besides setting the display parameters, the user can temporarily hide an overlay by unchecking its visibility checkbox (the first column). You can modify as many rows at once as you like; the updates do not take effect until you click the, "Update Display," button.
Zooming and Panning

Montage has a number of other image manipulation modules that allow great flexibility when generating a view in mViewer. One of these (mSubimage) supports general cutouts and another (mShrink) supports resizing (including by non-integer factors). Any piece of an image can be scaled to fit the current display window and resized when the browser window is resized.
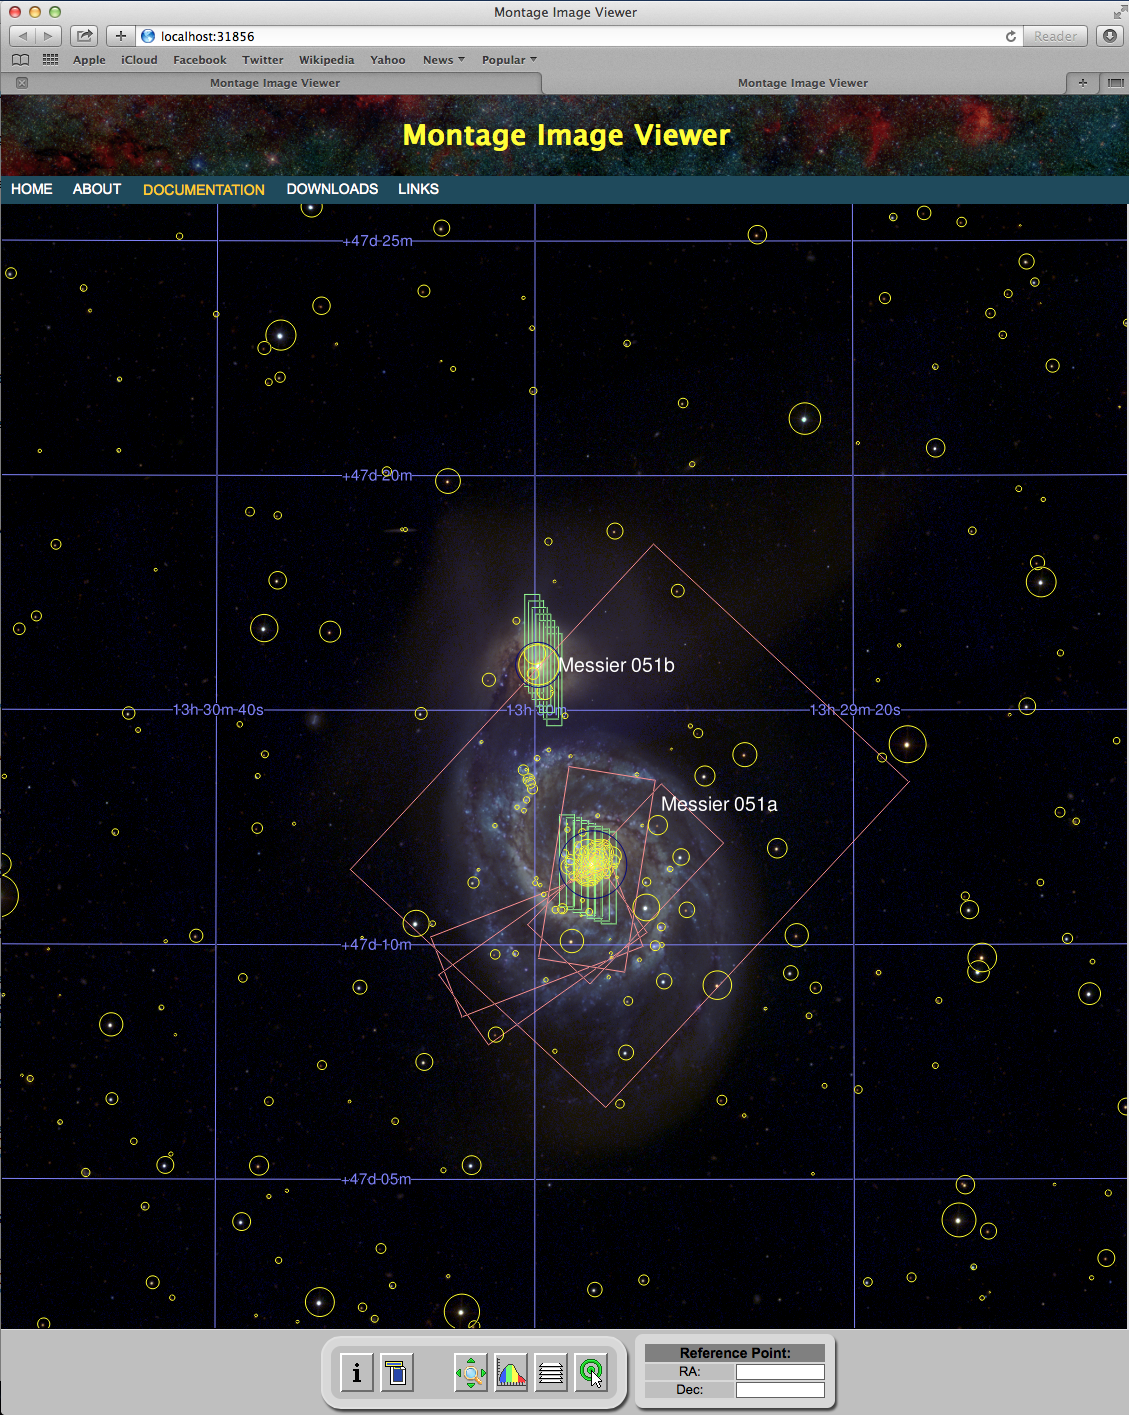
There are a number of ways to move around on the image, most of them covered by this control. It has standard zoom-in, zoom-out, and reset zoom options as buttons. Not on the control, the interface also allows the user to draw a box in the image and that region (padded to fit the window shape) will then fill the window.
Panning in the cardinal and diagonal direction (by half the current window) is supported by the arrow buttons on the form. The recenter button at the center of the form is tied to the "pick" function described below. If the user clicks on the image (whether the pick control is active or not), that location becomes current and is written to the "RA" and "Dec" fields at the bottom of the main display. If the user then clicks the recenter button, the image shifts its center to that point (while leaving the zoom alone).
Image Region Statistics
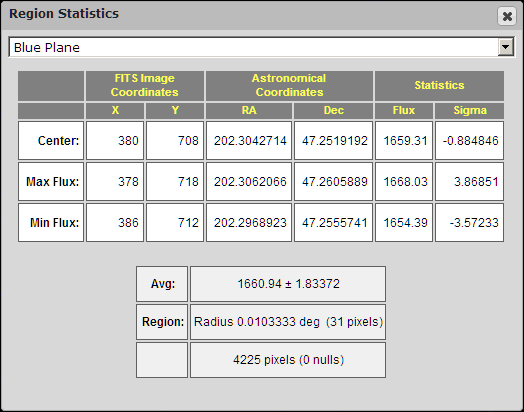
If this control is active, the "pick" click above also activates an area examine, resulting in statistics for a small region around the pick location. Included are summary statistics for the whole region, the coordinates and flux for the center pixel as well as the coordinates and flux for the brightest and dimmest pixels in the region.
FITS File Header
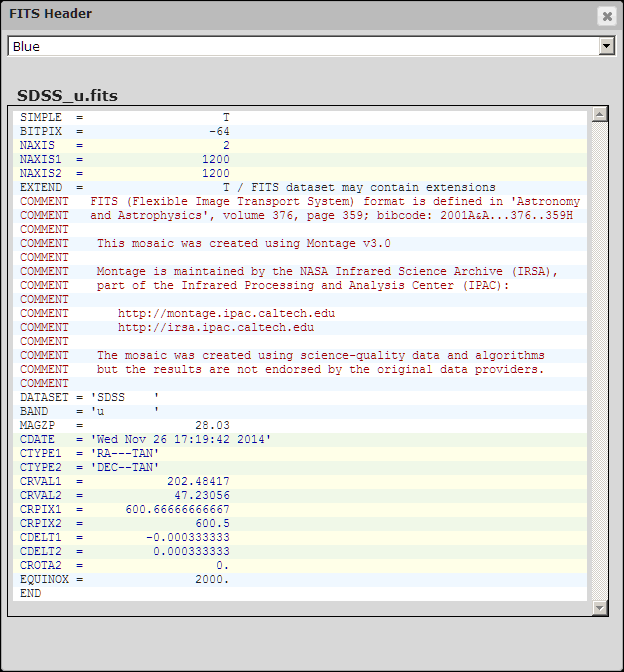
In the academic community, astronomical image files are pretty universally in FITS format. FITS (Flexible Image Transport System) was defined over thirty years ago to facilitate the sharing of data but has since become the defacto local storage format.
Besides the image data itself, all FITS images have header block consisting of keyword-value parameter pairs (plus a few other things like COMMENTs). FITS headers are ASCII text and thus easily readable; this control just shows a dump of the image header (or any one of the three headers for full-color displays). There is some color coding for comments, strings, etc.. In particular, there are a set of parameters that together define the image projection on the sky, referred to as WCS (World Coordinate System) parameters. These have their own color coding.
Display Image Info
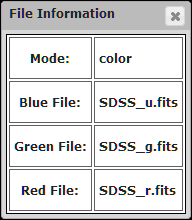
This control lists out the name of the image file (or the three image files) being used in the current display, along with the display mode.