Example Datasets
Nothing helps like a good example. Here are a few datasets that can be downloaded and displayed with mViewer (which is how the image shown here were created). Each one has been shrunken to 700 pixels in width; the original images are also downloadable in each case but many of them are a little too large for interactive viewing (mViewer can handle them, you just have to wait a while after every refresh).
Using other Montage tools (which you must have compiled along with the mViewer support services), you can play around with these larger images. Cutouts of the GLIMPSE images around M17 and M16 at full resolution are particularly impressive. See Montage documentation on mSubimage and mShrink for details.
You can also use the mViewer C executable to generate static PNGs of any of this. That isn't part of this project but interactive isn't always the best way to go.
About half of these images were constructed with the Montage reprojection / mosaicking tools in the first place and a couple (SDSS and 2MASS) can be reconstructed directly from (hundreds of) small original mission images that can be found and downloaded also using Montage command-line tools.
|
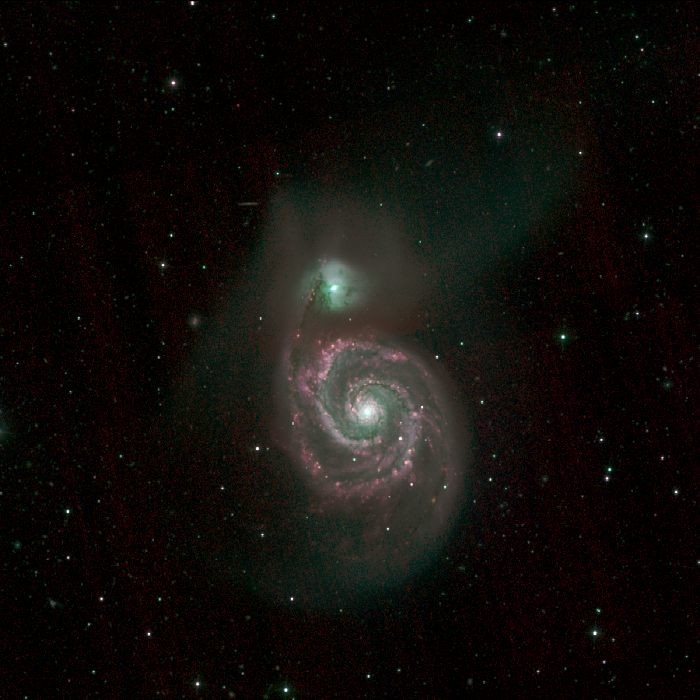
Sloan Digital Sky Survey Data:
Full images (1200x1200):
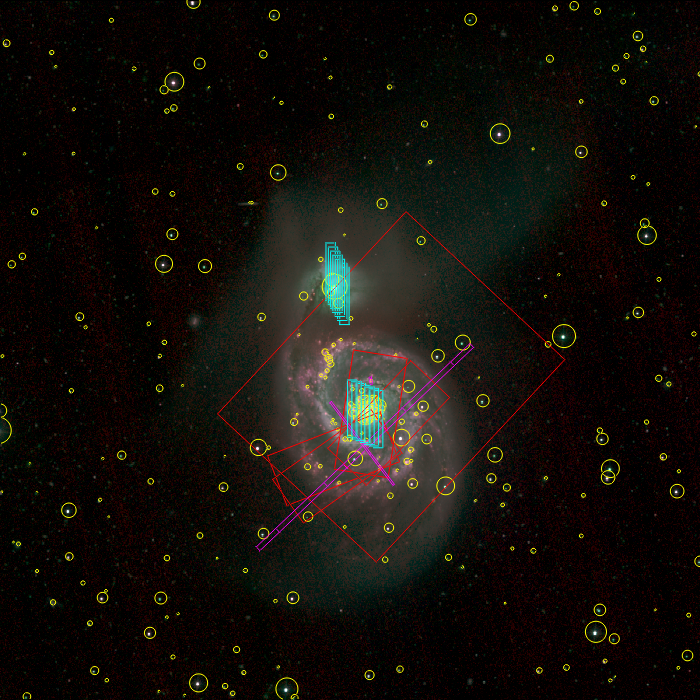
Overlays:
|
  |
|||||||||||||||||
|
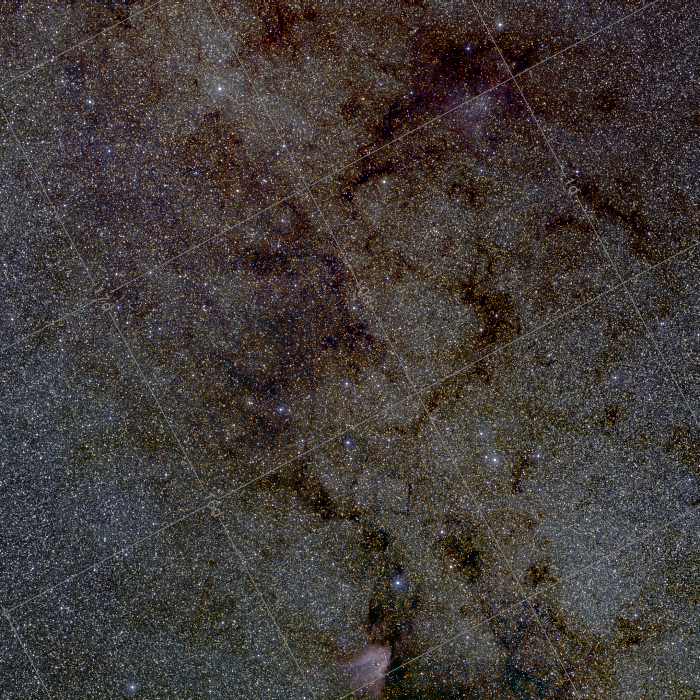
2MASS mosaic of the Data:
Full images (2160x2160):
|
 |
|||||||||||||||||
|
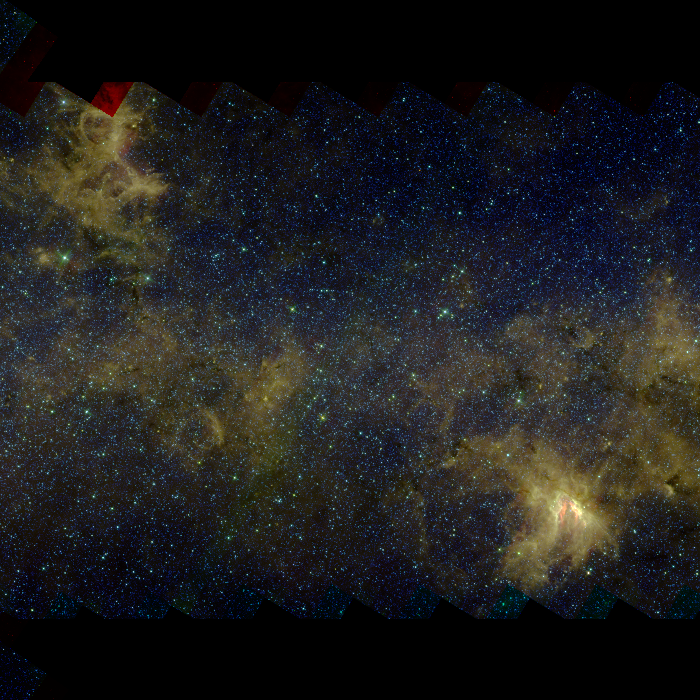
GLIMPSE mosaic of the Galactic plane covering roughly the same region. This image is in Galactic coordinates (2MASS was in Equatorial), so the two are rotated relative to each other by about 50 degrees. Data:
Full images (10801x10801):
|
 |
|||||||||||||||||
|
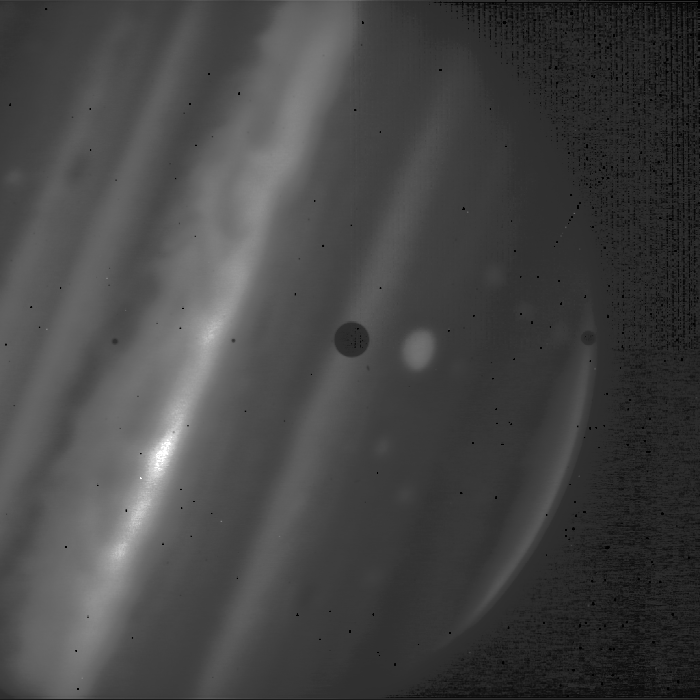
Image of Jupiter and moon This image does not of course include sky coordinates so no overlays can be added, but mViewer can still display it. Data:
Full image (1024x1024):
|
 |
|||||||||||||||||
|
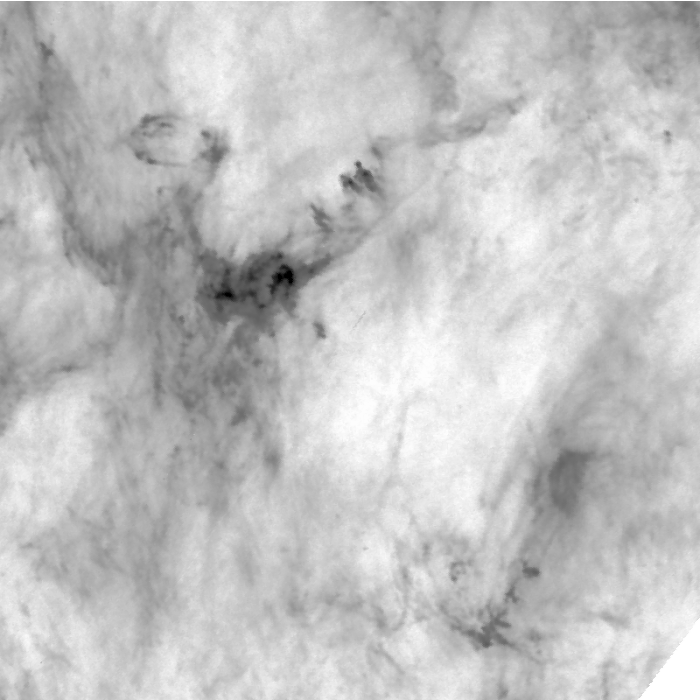
Planck mission image. Data:
Full image (800x800):
|
 |
|||||||||||||||||
|
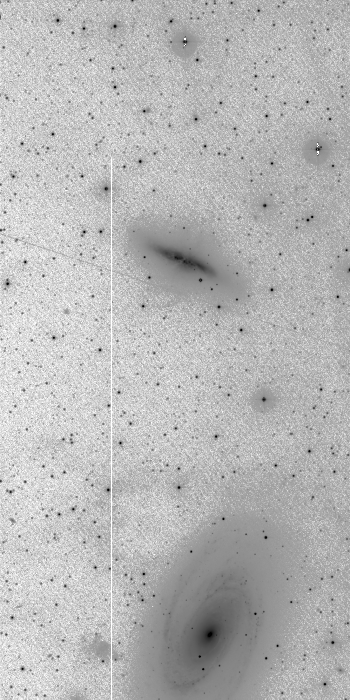
Caltech Palomar Transient Factory (PTF) image. Data:
Full image (2048x4096):
|
 |
|||||||||||||||||
|
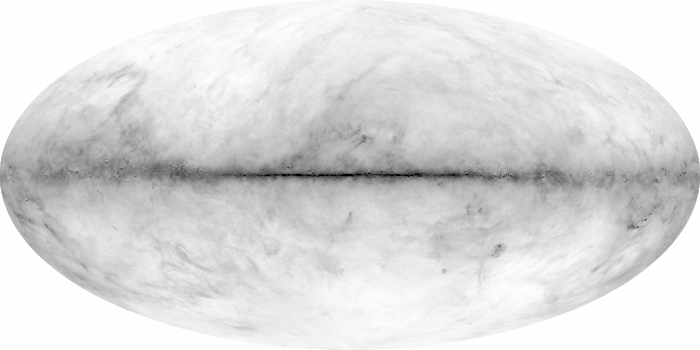
All-sky map of dust distribution in the Galaxy, derived from IRAS image data. Data:
Full image (7376x3688):
|
 |
|||||||||||||||||
|
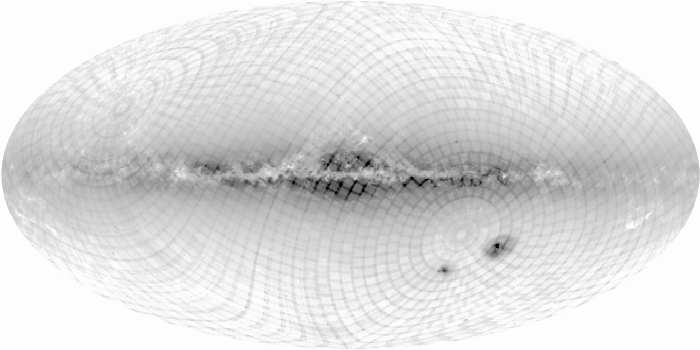
Count map generated from the USNO B1.0 source catalog. The blockiness is due to different count densities in overlap regions between adjacent original photographic plates (of which there were over several thousand in five wavelength bands). Data:
Full image (1300x650):
|
 |